library(tidyverse)
library(haven)

# clear memory
rm(list = ls())

theme_set(theme_classic())

# load HSB data
hsb <- read_dta("data/hsb.dta") |>
  select(mathach, ses, schoolid)

sch <- hsb |>
  group_by(schoolid) |>
  summarise(mean_ses = mean(ses),
mean_mathach = mean(mathach))18 Plotting Two Datasets at Once
It’s easy (though not always advisable) to plot two data sets at once with ggplot. First, we load tidyverse and our HSB data. We then create a school-level aggregate data set of just the mean SES values.
Let’s say we wanted to plot both the individual students and the school means. This is easy enough to do separately:
ggplot(hsb, aes(x = ses, y = mathach)) +
  geom_point(alpha = 0.1)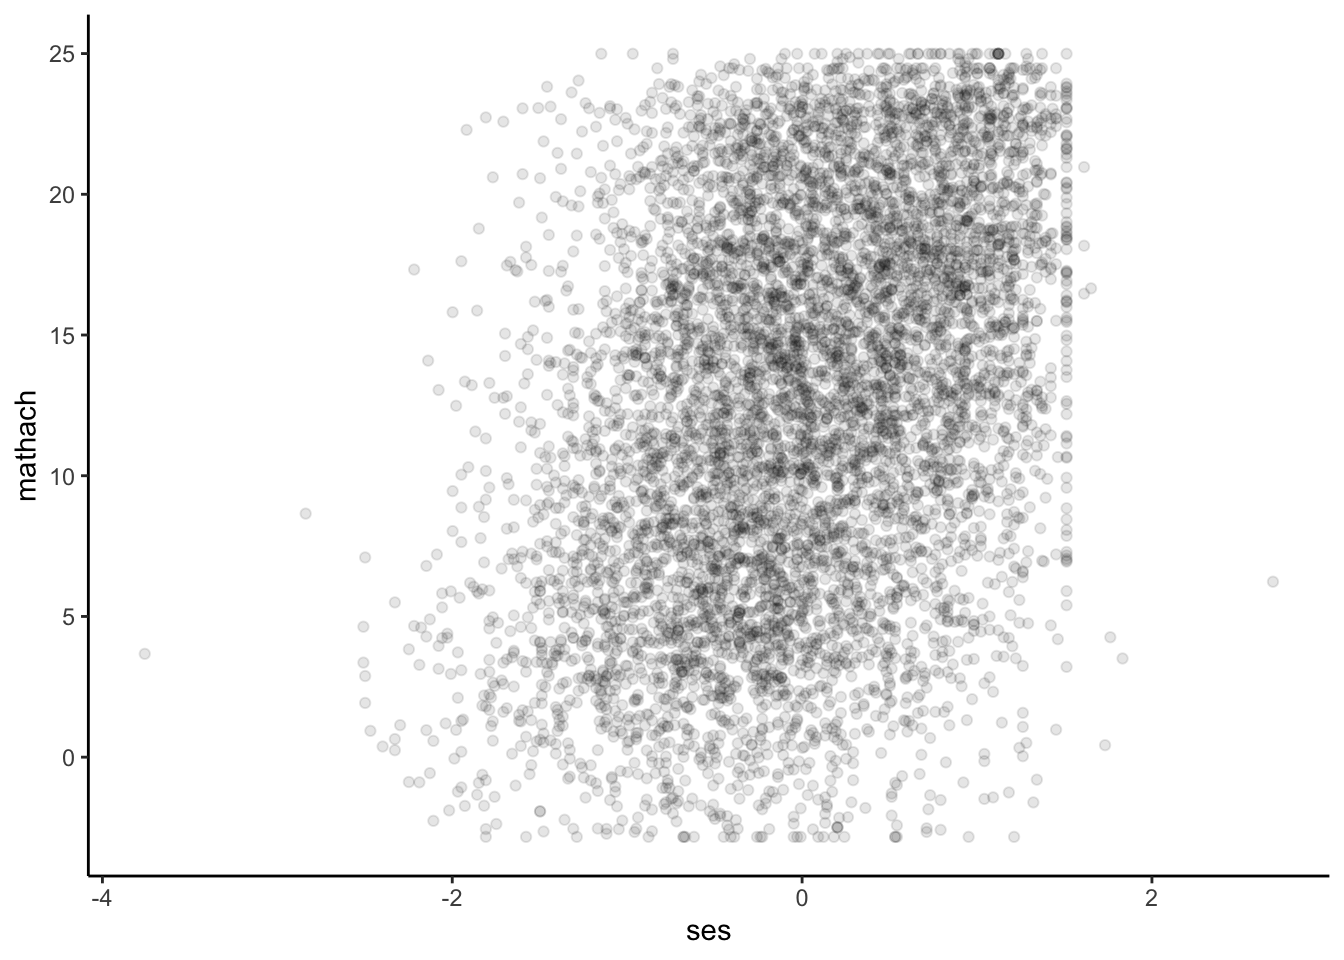
ggplot(sch, aes(x = mean_ses, y = mean_mathach)) +
  geom_point()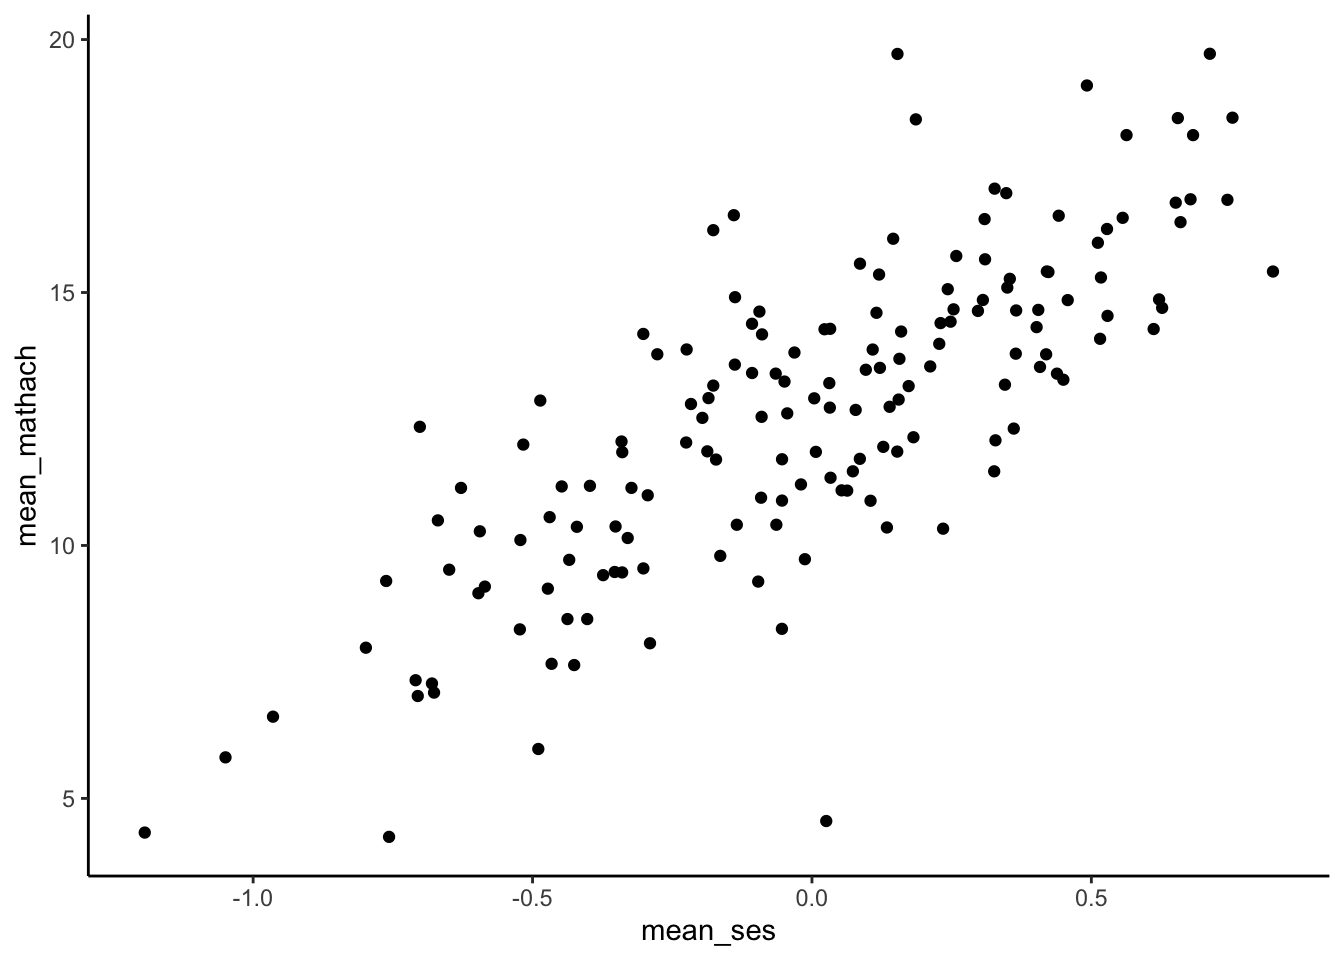
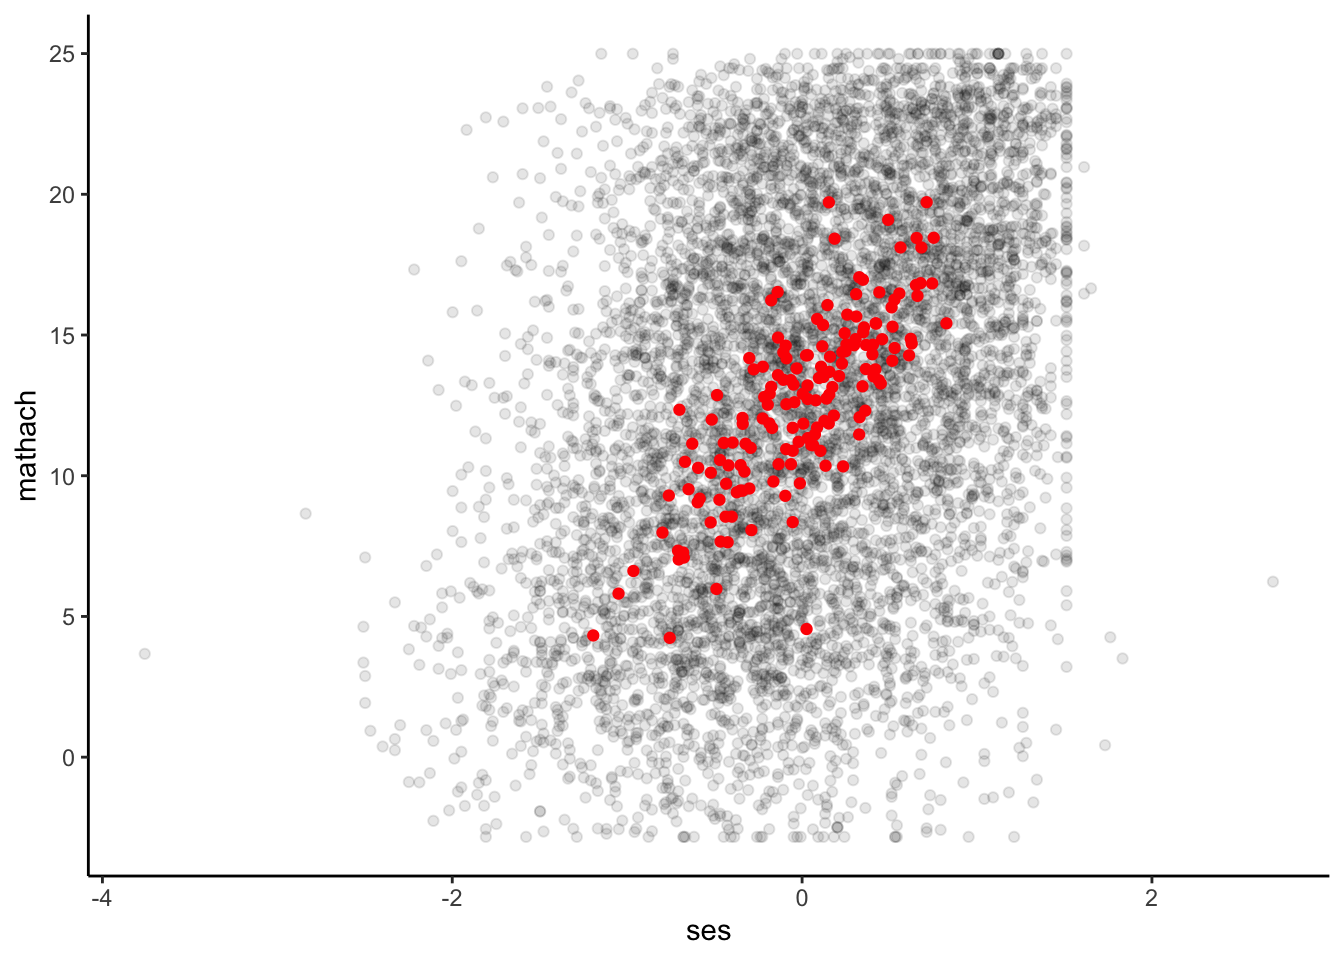
We can superimpose both plots as follows. Essentially, the first argument in ggplot provides the data, and by default, this is passed to all subsequent layers of the plot. We can override this behavior by specifying a different data set (and aesthetic mappings, if desired) within an individual layer of ggplot, such as geom_point.
ggplot(hsb, aes(x = ses, y = mathach)) +
  geom_point(alpha = 0.1) +
  geom_point(data = sch, aes(x = mean_ses, y = mean_mathach), color = "red")